
1) What is the US index?
In the US, stock market indices are benchmarks that summarize how different parts of the American stock market are performing. Because the US market is huge, no single index perfectly represents “the market.” Instead, investors and media use a few key indices that each capture a different slice:
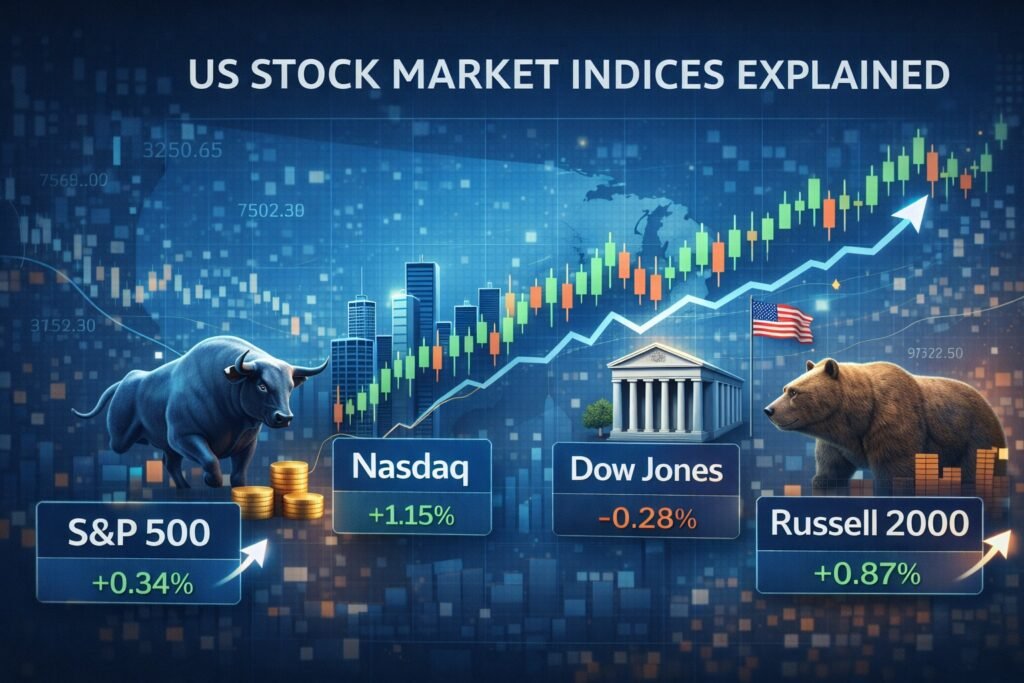
- S&P 500: often treated as the main benchmark for large US companies.
- Nasdaq Composite: exchange-based index that’s typically more tech- and growth-heavy.
- Dow Jones Industrial Average (Dow): a traditional, smaller index of 30 major companies.
- Russell 2000: a widely followed benchmark for small-cap US companies.
These indices matter because they influence how performance is reported, how funds are measured, and how sentiment is interpreted. When you see “US stocks climbed today,” it usually means one or more of these indices rose.
2) What does it include (and exclude)?
S&P 500
The S&P 500 includes about 500 leading US companies. It’s not purely “the 500 biggest.” Inclusion is based on eligibility rules and oversight by an index committee. Common requirements include:
- Large market size
- High liquidity (trades actively)
- Sufficient free float (shares available to the public)
- US domicile and primary listing criteria (rule-based)
Excludes: most small companies, many newly listed companies until they meet requirements, and companies that don’t meet float/liquidity rules.
Nasdaq Composite
The Nasdaq Composite includes most stocks listed on the Nasdaq exchange (thousands of names). It’s known as tech-heavy because many tech companies list on Nasdaq, but it also includes other sectors.
Excludes: stocks listed only on other exchanges (like NYSE-only firms) and companies not eligible under Nasdaq listing/index rules.
Dow Jones Industrial Average (Dow)
The Dow contains 30 large, well-known US companies. It’s curated and meant to be a traditional snapshot. It is not broad, and it doesn’t try to represent every sector proportionally.
Excludes: most of the market by count and many industries that aren’t represented in the 30.
Russell 2000
The Russell 2000 includes roughly 2,000 small-cap US companies, commonly derived from the broader Russell 3000 (large + small). It’s designed to track the smaller end of the market.
Excludes: large caps by design, and companies that fail eligibility or reconstitution rules.
3) How it’s calculated (price-weighted vs market-cap-weighted, etc.)
S&P 500: free-float market-cap weighted
The bigger the company (market cap adjusted for public float), the bigger its impact on the index. That means a small group of mega-cap stocks can meaningfully influence the S&P 500’s daily moves.
Nasdaq Composite: market-cap weighted (exchange-based universe)
It’s generally market-cap weighted, but because the Nasdaq exchange has a large concentration of tech and growth names, the index can behave differently from the S&P 500 in rate-driven markets.
Dow: price-weighted
This is a key difference. In a price-weighted index, companies with higher share prices have more influence, even if they’re smaller in total market value. Stock splits can change influence even if the business hasn’t changed.
Russell 2000: market-cap weighted small-cap index
This index is weighted by company size within the small-cap universe. It often reflects the health of domestically oriented US businesses and access to financing.
4) What moves the index day to day
US indices move because their constituents move, and their constituents react to expectations. Major day-to-day drivers include:
Earnings and guidance
- Big earnings surprises can move the S&P 500 and Nasdaq quickly, especially when large constituents report.
- For the Russell 2000, earnings matter too, but the index can also swing on broader risk mood.
Interest rates and bond yields
- Higher yields often pressure growth valuations (particularly Nasdaq-heavy growth names) because future profits are discounted more heavily.
- Lower yields can support growth valuations and boost risk appetite.
Inflation data and the Federal Reserve
- CPI, PCE inflation, jobs reports, and Fed statements often move the entire market.
- Markets react not just to the numbers, but to how they change expected interest rate paths.
Dollar moves
- A stronger dollar can reduce translated overseas earnings for US multinationals (important for S&P 500).
- A weaker dollar can have the opposite effect.
Risk sentiment and liquidity
- “Risk-on” days typically lift broad indices and especially growth.
- “Risk-off” days can hit small caps harder (Russell 2000) because they often have tighter margins and greater financing sensitivity.
Sector rotation
- Money flows between tech, financials, energy, defensives, etc. depending on macro conditions.
5) Why people track it (benchmarking, sentiment, economy)
People track US indices for several reasons:
- Benchmarking: Many funds compare performance to the S&P 500. If you’re a US equity manager, beating the S&P 500 is a common target.
- Sentiment gauge: Nasdaq strength can signal enthusiasm for growth and tech; Russell 2000 strength can signal confidence in domestic growth.
- Economic lens: Indices reflect profit expectations, which are influenced by the economy—though markets can diverge from economic reality for long periods.
- Product building blocks: Index funds and ETFs track these benchmarks, making them widely used reference points.
6) Common misconceptions
- “The Dow is the market.” It’s a small, price-weighted index; it’s widely quoted but not broad.
- “Nasdaq = only tech.” It’s tech-heavy, but not exclusively tech.
- “If the S&P 500 is up, most stocks are up.” A few mega-caps can lift the index even when breadth is weak.
- “Small caps always outperform in recoveries.” Often, but not always credit conditions, earnings quality, and rate levels matter.
7) Comparing global indices (FTSE 100, DAX, MSCI World) with US indices (S&P 500, Nasdaq, Dow, Russell 2000)
Use these comparisons to explain whether a market move is US-specific, Europe/UK-specific, or part of a global trend.
FTSE 100 vs US indices
What FTSE 100 represents: Large UK-listed companies, many with global revenue exposure. Often more tilted to energy, materials, and financials than the US market.
- FTSE 100 vs S&P 500:
If the S&P 500 outperforms, it can suggest stronger US broad-market leadership (often boosted by large US growth names).
If the FTSE 100 outperforms, it can reflect stronger performance in commodity-linked sectors, financials, or global earners—sometimes helped by GBP currency effects. - FTSE 100 vs Nasdaq:
Nasdaq is more growth/tech-heavy. If Nasdaq rises while FTSE 100 lags, it often signals a growth/tech-led environment.
If FTSE 100 holds up while Nasdaq weakens, it can indicate a more value/defensive tone or commodity support. - FTSE 100 vs Dow:
Both can behave more “old economy” compared to tech-heavy indices. If Dow and FTSE 100 outperform, it can signal preference for established, cash-generative sectors. - FTSE 100 vs Russell 2000:
Russell 2000 is US small caps and can be more sensitive to domestic growth and credit conditions. FTSE 100 is more global and large-cap. Divergence can reflect differences between US domestic risk and global large-cap resilience.
Read more about UK indices here: https://maximisefinance.com/uk-stock-market-indices-fully-explained/
DAX vs US indices
What DAX represents: Germany’s flagship index, often associated with industrial strength and export sensitivity.
- DAX vs S&P 500:
If S&P 500 outperforms, it can indicate US-led strength or stronger US earnings expectations.
If DAX outperforms, it can reflect stronger confidence in the global industrial/export cycle or improving European growth sentiment. - DAX vs Nasdaq:
DAX tends to be less tech-concentrated than Nasdaq. If Nasdaq leads, it often points to a rate-sensitive growth rally.
If DAX leads, it can suggest a cyclical/industrial leadership phase. - DAX vs Dow:
Both can be sensitive to industrial and cyclical conditions. If DAX and Dow lead, it can indicate markets favouring established cyclical sectors rather than high-growth tech. - DAX vs Russell 2000:
Russell 2000 reflects US small-cap domestic conditions; DAX reflects export-linked large caps. Divergence often highlights US credit/domestic demand versus global trade/industry expectations.
Read more about European Indices here: https://maximisefinance.com/european-stock-market-indices-fully-explained/
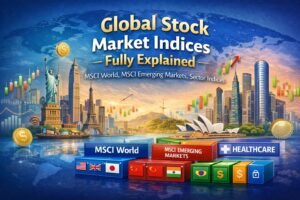
MSCI World vs US indices
What MSCI World represents: Developed markets global benchmark (a “world developed equities” yardstick).
- MSCI World vs S&P 500:
If S&P 500 outperforms MSCI World, it often suggests the global move is US-led (sometimes concentrated in a few mega-caps).
If MSCI World outperforms, it can signal broader developed-market strength outside the US (e.g., Europe/Japan contributing more). - MSCI World vs Nasdaq:
If Nasdaq outperforms MSCI World, it often indicates global returns are being driven by growth/tech leadership.
If MSCI World holds up better than Nasdaq, it can suggest a more balanced market or a rotation away from high-growth tech. - MSCI World vs Dow:
If Dow tracks MSCI World more closely than Nasdaq, it can hint that market leadership is more broad/industrial/defensive rather than tech-concentrated. - MSCI World vs Russell 2000:
Russell 2000 is typically more volatile and sensitive to US domestic conditions. If Russell 2000 leads, it can indicate stronger risk appetite and confidence in US domestic growth. If it lags while MSCI World is stable, it can suggest tighter US financial conditions or weaker small-cap sentiment.
Read more about World indices here: https://maximisefinance.com/global-stock-market-indices-fully-explained/
8) Quick glossary
- Free float: shares available to public investors.
- Breadth: how many stocks rise vs fall.
- Yield: interest rate on bonds; affects valuations.
- Growth stocks: priced on future expansion expectations.
- Small caps: smaller firms; often more volatile and rate-sensitive.
- Reconstitution: scheduled reshuffle of index membership (important for Russell indices).
Thanks for reading the MaximiseFinance guide on US stock market indices, if you want to read the Indices Fully Explained guide in depth and how they work, please click below


One Response